Dashboard
Key Metrics

At the top of the page, you’ll find a quick snapshot of your account:
- Total P&L – Your cumulative profit or loss across all launches
- Total Launches – Number of tokens launched
- Affiliate Revenue – Total rewards earned via referrals
- Affiliates – Number of referred users
- Affiliate Rate – Your current revenue share percentage
- USD / SOL - Change your stats Currency
These values update automatically as your activity evolves.
P&L Calendar
Open the P&L Calendar by clicking the calendar icon next to Total P&L.
It shows your performance day by day, with:
- Daily P&L
- Launch count per day
- Color-coded results (red = loss, neutral = no activity)
The monthly total P&L is displayed in the top-right corner.
Use the arrows to switch months.
This view is read-only and does not affect your launches.
Performance Over Time
Cumulative Performance
The left chart shows your global P&L evolution over time.
- Toggle between 1w · 1m · 1y · All
- Displays cumulative gains or losses
- Useful to understand long-term trends and drawdowns
Hovering the chart reveals precise values at each point in time.
Period Performance
The right chart breaks down performance by period.
- Each bar represents a specific month or timeframe
- Makes it easy to identify strong or weak periods
- Complements the cumulative view for deeper analysis
This view helps you spot which launches or phases had the biggest impact.
Referral Program
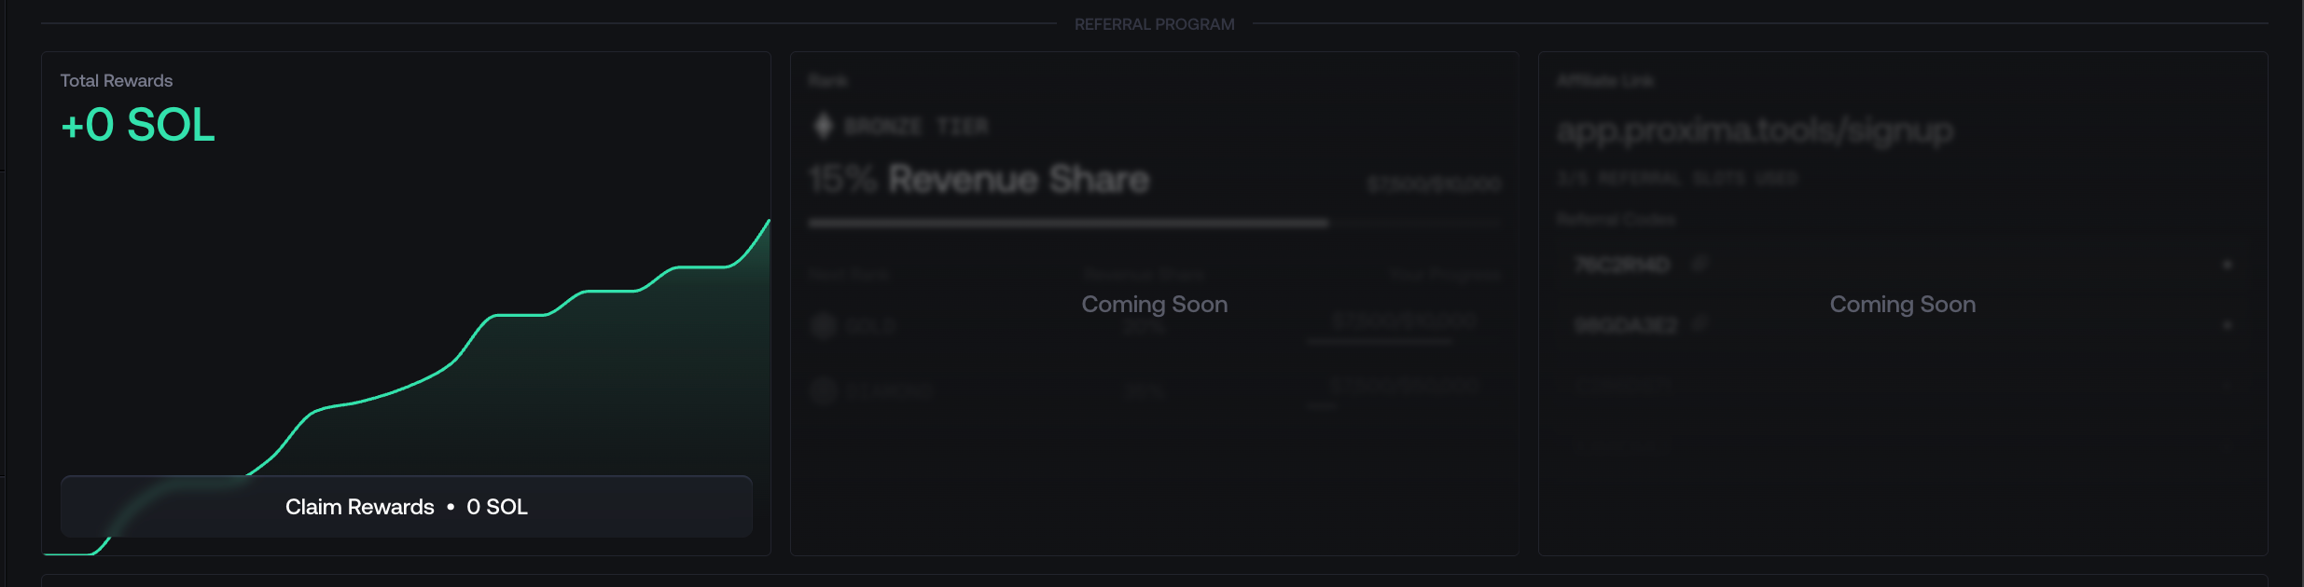
- Total Rewards – Earned referral fees (in SOL)
- Claim Rewards – Simply claim your referral rewards.
- 📩 Contact a Proxima admin to enable it.
Coming Soon
Additional referral features are planned, including:
- Affiliate tiers with higher revenue share
- Custom referral links